Difference between revisions of "Online Thermometer"
(→Enlaces) |
(→5º Paso: Crear una cuenta y un panel en el servidor de Ducksboard) |
||
| Line 246: | Line 246: | ||
The readings received by the server can be viewed in Carriots selecting "Data streams" option under "Data management" in the left menu of the control panel [https://cpanel.carriots.com/stream/] | The readings received by the server can be viewed in Carriots selecting "Data streams" option under "Data management" in the left menu of the control panel [https://cpanel.carriots.com/stream/] | ||
| − | ==== | + | ==== 5th Step: Create a new account and dashboard in Ducksboard server ==== |
| − | + | The cloud platform of Ducksboard is used in the project to visualise live sensor data without having to deploy or code a dedicated server. | |
| − | + | The first step is to create a Ducksboard account [https://app.ducksboard.com/signup/] (the trial account is free for one month but then you need to pay a subscription to keep the service). | |
| + | |||
| + | After creating the account, the next step is to personalise a dashboard. We will use the "Main dashboard" generated by default when the account is created. We will add two "widgets" or windows to the dashboard. In one of them we will just display the last temperature reading received. The other widget will show a list or "timeline" of the ñatest reported values. | ||
| − | |||
[[File:Ducksboard.jpg]] | [[File:Ducksboard.jpg]] | ||
| − | + | Click on the "+" button on the top left corner of the dashboard to define a new widget. In the following page, click on "Show your on data" (bottom part of the screen) | |
| + | |||
| + | Select option "Your own numbers" and then "Counters" to create the first widget. Next click on the "add this widget" button. This widget shows a counter with the last received value. It also draws in the background a historical graph of received values. | ||
| + | |||
| + | Now you can personalise the visual parameters of the widget: | ||
| + | * Name: The text that will shown to identify the widget window | ||
| + | * Color: The font color used to dsplay the sensor value | ||
| + | * Timeframe: The time scale used to represent the historical graph in the background (hours, days, weeks, etc.) | ||
| − | + | Choose your preferred values and click on "save preferences for this widget" at the bottom of the screen. | |
| − | + | Once the widget is created, Ducksboard lets you define alarms, "pull" received values, "push" new values from a device or a server, etc. In our case we will only use the "push" functionality to send temperature readings from Carriots server. To impelement this feature, you will need the following values available from the "DATA&API" tab of the widget: | |
| − | + | ||
| − | + | ||
| − | + | ||
| − | + | * PUSH DATA TO THIS URL: URL that Carriots will use to push the temperature readings | |
| + | * YOUR API KEY: string included in a header of the http request to identify the Ducksboard account and the widget. | ||
| − | + | These two values will be used in the next step. | |
| − | + | ||
| − | + | ||
| − | + | ||
[[File:Ducksboard_Widget.jpg]] | [[File:Ducksboard_Widget.jpg]] | ||
| − | + | The second widget represents the "timeline" of the latest tempereature values received by Ducksboard. From the "Main dashboard" click again on "+" button and then on "Show your own data". Now select "Your own text" and "Timelines" and finally choose "Size: 1 column/2 rows" option. We vill use later "PUSH DATA TO THIS URL" and "YOUR API KEY" values from "DATA&API" tab as in the previous widget. | |
| − | + | You can modify some configuration parameters of the dashboard by clicking on the settings icon (gear wheel) in the main window. For example you can change the background or the name of the dashboard. You can also share the dashboard through a public link or URL ("SHARE THIS DASHBOARD" tab inside "PREFERENCES FOR THIS DASHBOARD"). Ducksboard lets you give a name to the link for later reference and protect it with password so that only people that know the secret password can access the dashboard content. Use "COPY LINK" to copy the public URL of the dashboard to the clipboard. | |
==== 6º Paso: Publicación de los datos de temperatura en Ducksboard desde el servidor de Carriots ==== | ==== 6º Paso: Publicación de los datos de temperatura en Ducksboard desde el servidor de Carriots ==== | ||
Revision as of 22:24, 8 February 2014
Contents
- 1 Connected Online Thermometer
- 1.1 Aim
- 1.2 Motivation
- 1.3 Background/Prerequisites
- 1.4 Required HW and Cloud Services
- 1.5 Summary
- 1.6 Detailed Description
- 1.6.1 1st Step: Read the temperature value from Arduino and pass it to 'imp' device
- 1.6.2 2nd Step: Connect Arduino and 'imp' through a voltage converter
- 1.6.3 3rd Step: Create a new account and device in Carriots server
- 1.6.4 4th Step: Reception of temperature readings by 'imp' device and upload to Carriots cloud server
- 1.6.5 5th Step: Create a new account and dashboard in Ducksboard server
- 1.6.6 6º Paso: Publicación de los datos de temperatura en Ducksboard desde el servidor de Carriots
- 1.7 Enlaces
Connected Online Thermometer
STATUS: Initial version
Miembros: User:Tumaku
Aim
Post online the temperature of a thermometer through the cloud servers of ElectricImp, Carriots and Ducksboard

Motivation
Start working on a real project with the samples donated to Makespace by electricImp. When installed, the project will allow members to check online the temperature of Makespace Madrid
Background/Prerequisites
The user already has an electricImp account and has configured the electricImp device with the parameters of the WiFi network. These steps are described in Hola Mundo eImp
Required HW and Cloud Services
This project requires the following HW and cloud services:
- DHT11 temperature sensor [1]
- Arduino Uno (or Pro Mini 5V)
- Level converter [2]
- 'imp' device by ElectricImp with free account and cloud service [3]
- Free account and cloud service of carriots [4]
- Free trial account and cloud service of ducksboard [5]
Summary
The project publishes online the temperature readings obtained from a DHT11 sensor.
- The reading is obtained by through an Arduino (Arduino is used because the current version of electricImp does not support the proprietary protocol of the DHT11 sensor). Temperature is read once a minute
- The temperature reading is passed to an imp device that forwards it to an agent in the cloud server of ElectricImp
- The agent sends the reading to Carriots through its http REST API. Carriots is used to keep the historical series of all measured temperature values
- When Carriots server receives a new temperature reading, a "listener" makes a new http REST request towards Ducksboard server to update a "dashboard" that displays the latest temperature values received
Detailed Description
1st Step: Read the temperature value from Arduino and pass it to 'imp' device
The DHT11 temperature sensor is very easy to use but it is not "compatible" with the imp HW due to the proprietary protocol of the sensor. Additionally, it runs at 5V while the 'imp' works at 3.3V. electricImp recommends using an intermediate micro (arduino) to read the temperature and then forward the reading to the imp through a serial connection [6]
The temperature is read from Arduino using a library and sketch written by Rob Tilliart [7]. The link describes how to install and use the library from Arduino IDE.
Note: The DHT11 sensor shown in the previous link has four PINs on the bottom. However the PCB mounted version sold by DealeXtreme [8] has only 3 PINs. The following picture describes the function of each PIN:

The Arduino sketch simply reads the temperature from DHT11PIN (digital pin 2 of the Arduino) and sends the read value through a serial connection (Arduino digital PINs 7 and 8: SoftwareSerial eImpSerial(7, 8)). A special code (byte 0xFC) is sent after the temperature value to inform to the other end of the serial connection (the 'imp') that a new value is available.
After forwarding the temperature reading to the 'imp', arduino waits for a minute (60000 milliseconds) until the next reading.
Find hereafter the Arduino sketch:
/*
Simple sketch to read Temperature from DHT11 sensor
Written by Javier Montaner @tumaku_ for Makespace Madrid
http://www.makespacemadrid.org

Based on YourDuino.com Example Software Sketch
DHT11 Humidity and Temperature Sensor test
Credits: Rob Tillaart
http://arduino-direct.com/sunshop/index.php?l=product_detail&p=162
terry@yourduino.com */

#include <dht11.h>
#include <SoftwareSerial.h>

dht11 DHT11;

#define DHT11PIN 2
SoftwareSerial eImpSerial(7, 8); // RX, TX

void setup()
{
   Serial.begin(9600);
   eImpSerial.begin(9600);
   Serial.println("DHT11 TEST PROGRAM ");
   Serial.print("LIBRARY VERSION: ");
   Serial.println(DHT11LIB_VERSION);
   Serial.println();
}

void loop()
{
   int chk = DHT11.read(DHT11PIN);
   Serial.print("Temperature (oC): ");
   Serial.println((float)DHT11.temperature, 2);
   eImpSerial.print((float)DHT11.temperature, 2);
   eImpSerial.write(0xFC);
   delay(60000);
}
2nd Step: Connect Arduino and 'imp' through a voltage converter
'imp' works at 3.3V while Arduino works at 5V. You cannot connect their PINs directly because you could burn the 'imp' with the higher voltage generated by Arduino. The solution is to connect them through an intermediate voltage converter. This project has chosen a Sparkfun converter [9] but any other similar converter could be used. There is a tutorial on Sparkfun website that explains how this component works. It also includes an example showing how to wire a serial connection between Arduino and electricImp "Using the LLC for Serial" paragraph. Make connections as shown in the picture but keep in mind that our Arduino uses pins 7 and 8 for the serial connection. Wires coming out of 0/RX0 (green) and 1/TX0 (yellow) should come out of PINs 7 and 8.
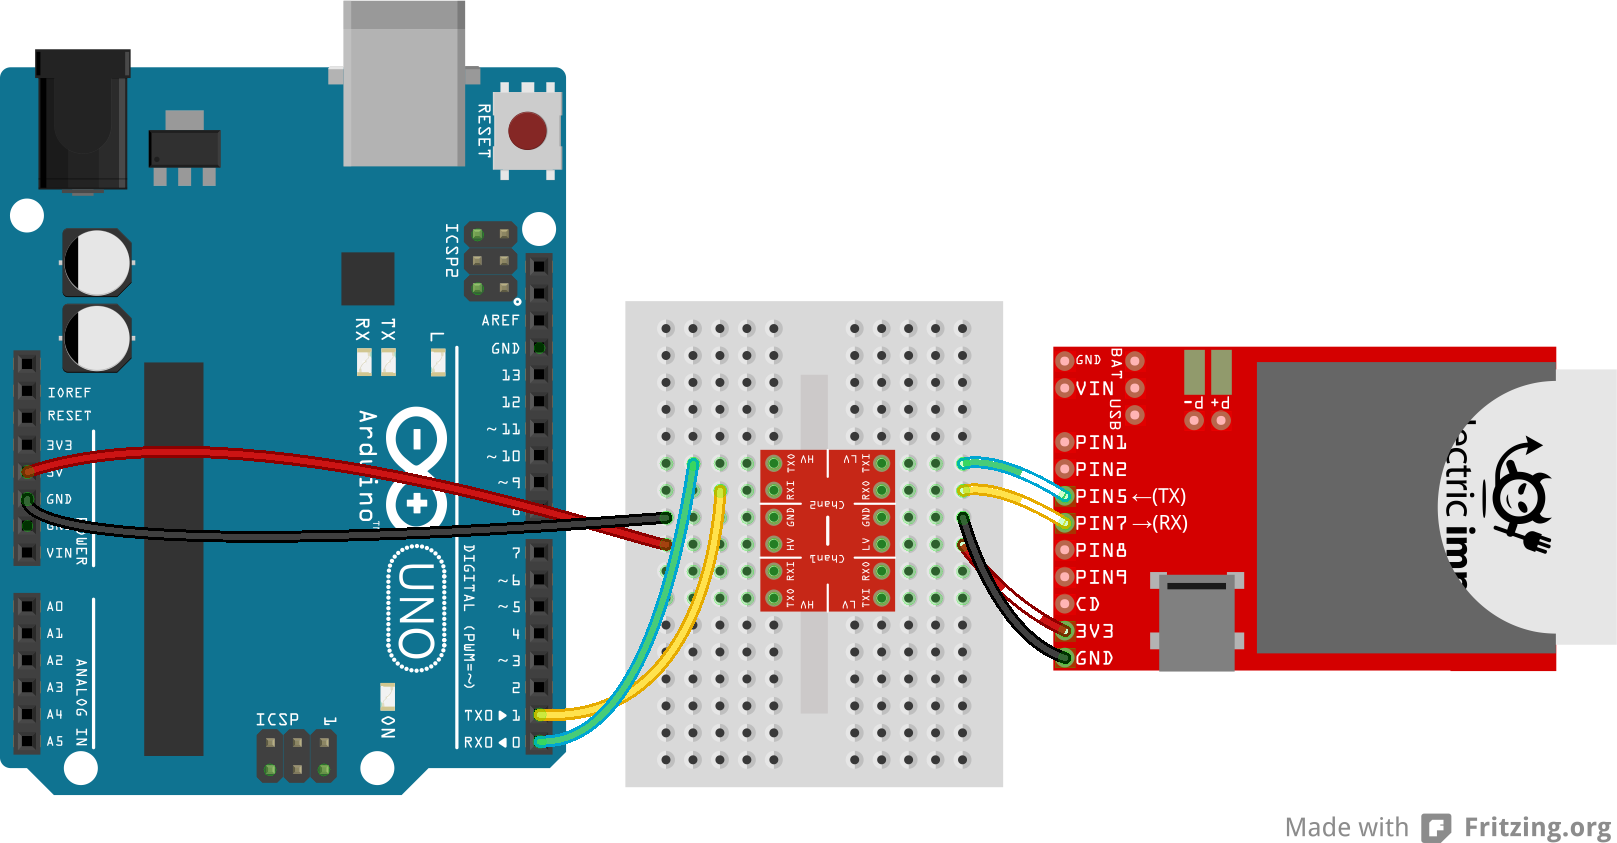
Important: Arduino serial connection uses pins 7 and 8 (not pins 0 and 1)
3rd Step: Create a new account and device in Carriots server
The cloud platform of Carriots is used in the project to store historical series of sensor readings. This enables realtime and offline datamining. In our case we could check the evolution of temperature in time and correlate it with the ambient temperature values published by the City of Madrid or AEMET.
After creating an account in Carriots server [10], a device is created to store the temperature readings obtained from the DHT11 sensor. To do this, go to Carriots Control pannel [11]. Select "Device Management" and then "Devices" in the menu shown on the left of the page [12]. In this page the user can see all his devices and can create new ones with the "New" button.
Selecting the "New" option brings the user to the "New device" form. Although there are many parameters, it is enought to fill in the following values:
- Name: select a unique name. It automatically generates the deviceId or Id developer as "deviceName@username" (this value is important because it is used to identify the sensor data when it is sent from this device to Carriots platform)
- Type: Other
- Sensor: Temperature
- Enabled: Checked (Carriots discards messages/readings received from a device thet is not "Enabled")

4th Step: Reception of temperature readings by 'imp' device and upload to Carriots cloud server
In a previous tutorial Hola Mundo eImp (in Spanish) we already explained that electricImp supports local applications running on the 'imp' device as well as 'agents' running in the cloud server of electricImp. This feature facilitates the deployment of Internet services and we will use it to send the temperature data received from Arduino to Carriots server.
It is recommended to review section "2º Paso: Cargar la aplicación Hola Mundo" Hola Mundo eImp before proceeding with this tutorial.

Detailed steps:
- Log in to electricImp to access its IDE
- Look for the 'imp' device that we are using in the left navigation menu (the 'imp' device might be under the "New Devices" tab or under the tab or any of the models that have been defined)
- Click on the settings icon to the right of the 'imp' device
- Click on the "Associated Model" drop-down list and type the name of the new model that we are going to create "Temperature Carriots".
- Click "Save Changes"
- The "Temperature Carriots" model will appear in left the navigation menu. Click on it, the name of our device will pop up. Either automatically or after clicking on the device name, the main area of the IDE will display the code editor where we will define the application
- Our application requires code on the device as well as on the server. The server code is included in the box called "Agent" and the device code in the "Device" box.
- Copy and paste the code below inside the "Device" box
server.log("Device Started");
local s="";
local sSize=0;
arduino <- hardware.uart57;

function arduinoData() {
 local b = arduino.read();
 while(b != -1) {
   sSize++;
   if (sSize>10) {
      sSize=0;
      s="";
      server.log("reset string");
   }
   if (b == 0xFC) {
       agent.send("sendTemperature", s);
       server.log(s);
       sSize=0;
       s="";
   }
   else {s= s+b.tochar();}
   b = arduino.read();
 }
}

arduino.configure(9600, 8, PARITY_NONE, 1, NO_CTSRTS, arduinoData);
- Copy and paste the following code inside the "Agent" box:
const CARRIOTS_URL = "http://api.carriots.com/streams/";
const jsonStringA= "{\"protocol\":\"v1\",\"at\": \"now\",\"device\":\"your_device_id\",\"data\":{\"temp\":\"";
const jsonStringB="\"},\"checksum\":\"\"}";

function postTemperature(tempString) {
 local body = jsonStringA + tempString + jsonStringB;
 local request = http.post(CARRIOTS_URL, {"carriots.apiKey":"your_api_key"}, body);
 local resp = request.sendsync();
 server.log("HTTPResponse: " + resp.statuscode + " - " + resp.body + " " + tempString);
}

device.on("sendTemperature", postTemperature);
Note: You have to replace in the codethe strings your_device_id and your_api_key by the values obtained in the previous step
- Click "Build and Run" button at the top of the IDE. The application compiles and any errors are displayed on the console box. If there are no errors, electric imp server will download the application into your 'imp' over Internet (the 'imp' must be on and connected to a wifi network)
- Once the application is loaded, it will begin to run. The imp device waits to receive data from Arduino through the serial connection. When it receives a temperature reading, it forwards it to the agent on the ElectricImp server and also post a new message in the Log window of the IDE. On receiving this new reading, the agent forwards it to Carriots server and posts a new message in the Log window registering the result of this submission
Detailed explanation of the 'imp' device code
In the previous tutorial we explained that the 'imp' code is executed sequnetially starting from the first line (functions are identified with the function key word and are skipped from the sequential flow).
Disclaimer: I am not an expert in squirrel, the programming language used by electricImp. I apologise for the poor quality of the code
The code defines variable s to store the char string received from Arduino through the serial connection. The length of the string is stored in sSize (I am sure that squirrel can handle strings in a simpler way but I could not find it)
The serial connection is defined in the arduino variable. It uses PINS 5 and 7 (uart57):
arduino <- hardware.uart57;
This variable is initialises further down in the code. On top of defining the technical parameters of the serial connectiom, we also indicate the function (arduinoData()) that the 'imp' device will call every time that it receives new data over the connection:
arduino.configure(9600, 8, PARITY_NONE, 1, NO_CTSRTS, arduinoData);
The electricImp docummentation has more information about how to manage serial connections in 'imp' [13]
The arduinoData() function is responsible for listening to the Arduino serial connection. When a byte is received, the 'imp' device calls this function. arduinoData() reads the input bytes and stores them as a char string in s. This process continues until a byte valued 0xFC is received. This value is the same one defined in the Arduino sketch to identify the end of a data transmission. If more than 10 bytes are received without receiving an end code, the function assumes that the data is corrupt and it resets variable s.
When the code to send the function receives arduinoData () sends the string stored in the variable s (the data received from Arduino) the agent is running on the server in the cloud ElectricImp:
When an end code 0xFC is received, arduinoData() sends the string stored in variable s to the electrcImp agent that is running in the cloud:
agent.send("sendTemperature", s);
Function agent.send() has two parameters. The first one is the name of the message that will be recived by the sgent in the server (sendTemperature in our code). The second parameter is the object that will be passed as a parameter to the agent function that will receive the message. ore information can be found in the API docummentatio of electricImp ([14] , [15] )
Detailed explanation of the agent code on ElectricImp server
The agent is also coded in squirrel.
In this project, the agent is only triggered when it receives a message from its 'imp' associated device. We have just explained that the 'imp' device calls function agent.send() to send a message to the agent. On the agent side, you use the function device.on() to register the function that will process this incoming message:
device.on("sendTemperature", postTemperature);
This function has two parameters. The first one is the name of the message (sendTemperature in our case) and the second one is the function in the agent that will process this message (postTemperature() in the example). The second parameter that the 'imp' device includes when calling the function agent.send() is an object whose value is passed as a parameter to the function indicated by the agent.
Focusing on our example, the 'imp' device sends the message sendTemperature and includes the string received from Arduino as the second parameter (in fact, a temperature reading). The agent on the server receives this message and calls the function postTemperature() passing as parameter the string generated by the Arduino (temperature reading).
The postTemperature() function just formats an http POST request according to API of Carriots. The request includes in its BODY a JSON string with the temperature value received from the device. This request adds a new reading in Carriots server.
Details on how the http request works are described in the API documentation of eletricImp http, http POST, http request.
The format of the request to Carriots server is defined in its API. Tutorial How to send a stream using cURL explains in detail how to format the request headers and parameters.
In our case, we make a request to http://api.carriots.com/streams/. The header must include Carriots API key (the API key of the user who created the device in Carriots and that is entitled to send readings from the device). Replace in the agent code your_api_key by the actual value of the API key.
To retrieve the API key, go to Carriots console and click on "MySettings" tab and then on "My Account" on the menu at the top of the screen. The API key value is the one named Full Privileges Apikey.
Carriots expects a JSON object as the BODY of the http request, . Its format is as follows:
{
   "protocol":"v1",
   "at":"now",
   "device":"your_device_id",
   "data":{
        "temp":"21"
   },
   "checksum":""
}
The timestamp of a reading is indicated in the parameter at. In the example, we use the string now . This value indicates the Carriots to store the received reading with the system of Carriots server when the message is received.
Replace your_device_id in the agent code with the actual identity of the device in Carriots (e.g. TempMSM@makespacemadrid).
The readings received by the server can be viewed in Carriots selecting "Data streams" option under "Data management" in the left menu of the control panel [16]
5th Step: Create a new account and dashboard in Ducksboard server
The cloud platform of Ducksboard is used in the project to visualise live sensor data without having to deploy or code a dedicated server.
The first step is to create a Ducksboard account [17] (the trial account is free for one month but then you need to pay a subscription to keep the service).
After creating the account, the next step is to personalise a dashboard. We will use the "Main dashboard" generated by default when the account is created. We will add two "widgets" or windows to the dashboard. In one of them we will just display the last temperature reading received. The other widget will show a list or "timeline" of the ñatest reported values.

Click on the "+" button on the top left corner of the dashboard to define a new widget. In the following page, click on "Show your on data" (bottom part of the screen)
Select option "Your own numbers" and then "Counters" to create the first widget. Next click on the "add this widget" button. This widget shows a counter with the last received value. It also draws in the background a historical graph of received values.
Now you can personalise the visual parameters of the widget:
- Name: The text that will shown to identify the widget window
- Color: The font color used to dsplay the sensor value
- Timeframe: The time scale used to represent the historical graph in the background (hours, days, weeks, etc.)
Choose your preferred values and click on "save preferences for this widget" at the bottom of the screen.
Once the widget is created, Ducksboard lets you define alarms, "pull" received values, "push" new values from a device or a server, etc. In our case we will only use the "push" functionality to send temperature readings from Carriots server. To impelement this feature, you will need the following values available from the "DATA&API" tab of the widget:
- PUSH DATA TO THIS URL: URL that Carriots will use to push the temperature readings
- YOUR API KEY: string included in a header of the http request to identify the Ducksboard account and the widget.
These two values will be used in the next step.

The second widget represents the "timeline" of the latest tempereature values received by Ducksboard. From the "Main dashboard" click again on "+" button and then on "Show your own data". Now select "Your own text" and "Timelines" and finally choose "Size: 1 column/2 rows" option. We vill use later "PUSH DATA TO THIS URL" and "YOUR API KEY" values from "DATA&API" tab as in the previous widget.
You can modify some configuration parameters of the dashboard by clicking on the settings icon (gear wheel) in the main window. For example you can change the background or the name of the dashboard. You can also share the dashboard through a public link or URL ("SHARE THIS DASHBOARD" tab inside "PREFERENCES FOR THIS DASHBOARD"). Ducksboard lets you give a name to the link for later reference and protect it with password so that only people that know the secret password can access the dashboard content. Use "COPY LINK" to copy the public URL of the dashboard to the clipboard.
6º Paso: Publicación de los datos de temperatura en Ducksboard desde el servidor de Carriots
En este último paso el servidor de Carriots publica los valores de temperatura en el panel de Ducksboard que se acaba de definir. Para ello, se utiliza el API http de Ducksboard.
La plataforma de Carriots permite definir "listeners", bloques de código que se ejecutan cuando suceden determinados eventos, como por ejemplo la recepción de una nueva medida de un sensor. Este código se ejecuta en la plataforma en la nube de Carriots y se programa en groovy, un lenguaje dinámico basado en la máquina virtual de Java (JVM). Básicamente un listener define una regla basada en una condición. Si pasa A entonces ejecuta B y, si no, ejecuta C.

La documentación de Carriots incluye un tutorial detallado sobre cómo crear un listener [18]. Siguiendo este tutorial vamos a ver cómo enviar los valores de temperatura a Ducksboard. En la página de creación de un nuevo listener se definen los siguientes parámetros:
- Name: el valor que queramos darle a este listener (por ejemplo "temperaturaDucksboard")
- Description: explicación de lo que hace (por ejemplo "envío de valores de temperatura a Ducksboard")
- Entity type: Device (este listener aplica sólo a nuestro dispositivo)
- Id: seleccionar la identidad del dispositivo creado en el paso 3
- Event: Event Data Received (el listener será llamado cada vez que se reciba un valor desde el dispositivo seleccionado)
- Enabled: seleccionado (si no se marca, el listener no está activo y no se ejecutará)
La lógica del listener se descibe en los campos If, Then, Else. En nuestro ejemplo, siempre enviamos el valor recibido a Ducksboard sin hacer ningun chequeo (en un proyecto real convendría hacer un chequeo de formato). La condición IF es siempre cierta (true) y no hace falta definir una claúsula ELSE.
If expression:
        (true)
Then expression:
        import com.carriots.sdk.utils.BasicHttp;
        def basicHttp = new BasicHttp();
        def map= ["user" : "your_ducksboard_api_key", "password":"unused"];
        basicHttp.http_auth=map;
        //basicHttp.url ="https://push.ducksboard.com/values/296067";
        basicHttp.url ="your_ducksboard_PUSH_URL_counter_widget";
        basicHttp.verb ="POST";
        basicHttp.payload='{"timestamp": '+ context.envelope.at + ', "value": ' + context.data.temp + '}';
        basicHttp.send();

        def basicHttp2 = new BasicHttp();
        def map2= ["user" : "your_ducksboard_api_key", "password":"unused"];
        basicHttp2.http_auth=map;basicHttp2.url ="your_ducksboard_PUSH_URL_timeline_widget";
        basicHttp2.verb ="POST";
        Date d= new Date();
        basicHttp2.payload='{"value":{"title": "Temperatura: ' + context.data.temp  +'", "image": ' +
             '"https://app.ducksboard.com/static/img/timeline/green.gif" , "content":"Tiemstamp: '+ d.toString() +'"}}';
        basicHttp2.send();
El código de la claúsula Then simplemente envía dos peticiones http POST al servidor de Duckstore siguiendo el formato JSON de su API. La primera petición se envía al widget Counter y la segunda al widget Timeline. La doucmentación de Carriots incluye un tutorial para integrar Ducksboard que explica en detalle este código .
Importante: sustituir en el código los valores your_ducksboard_api_key, your_ducksboard_PUSH_URL_counter_widget, your_ducksboard_PUSH_URL_timeline_widget por los valores que se han obtenido en el paso 5.
Una vez creado el listener, cualquier lectura de temperatura recibida por Carriots desde electricImp (paso 4) será reenviada a los dos widgets de Ducksboard. Además la medida también quedará almacenada en el servidor de Carriots
Nota: Los datos de temperatura se podrían enviar directamente desde el agente de electricImp a los widgets de Ducksboard sin necesidad de pasar por el servidor de Carriots, pero en ese caso se perdería la serie histórica de medidas.
Enlaces
- Link to the public ducksboard of the temperature sensor used in this example: [19]
